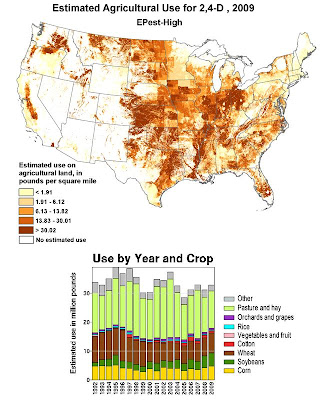
Ever wonder what fungicides, insecticide or herbicides are used across the county? Have you been curious to know the levels of use? The US Geological Survey now has interactive maps to let you explore the trends of pesticide use from 1992 to 2009.
The new interactive national maps and trend graphs (http://water.usgs.gov/nawqa/pnsp/usage/maps) show the distribution of the agricultural use of 459 pesticides for each year during 1992-2009 for the entire conterminous U.S. The maps and supporting national database of county-level use estimates for each pesticide were developed by the U.S. Geological Survey for use in national and regional water-quality assessments.
Labels
- Alert (2)
- Bark Beetles (6)
- Biocontrol (3)
- BMSB (2)
- BugwoodApps (3)
- Citizen Science (3)
- Cogongrass (4)
- Conferences (2)
- Data (3)
- EDDMapS (10)
- EDDMapS West (1)
- Forest Pests (5)
- Forestry Images (6)
- Image Recruitment (3)
- Insect Images (6)
- Invasive Species (71)
- IPM (2)
- IPM Images (19)
- Kudzu bug (10)
- Publications (1)
- Research (3)
- SEEDN (5)
- Technology (5)
- Widely Prevalent Bacteria (1)
- Widely Prevalent Fungi (1)
- Widely Prevalent Viruses (1)
Contributors
The University of Georgia
Center for Invasive Species
and Ecosystem Health
Center for Invasive Species
and Ecosystem Health

